[ad_1]
- Bitcoin hit new all-time highs and looks to set a new target of $100K as next significant number.
- Ethereum price broke a bearish top line and could hit new all-time highs by the end of this week.
- Ripple price sees both bears and bulls waiting on the sideline.
Bitcoin price joined the new high club with the S&P 500, Nasdaq and Dow Jones, after peaking at a new all-time high of $67,176 on Wednesday. The catalyst was the launch of the first U.S. Bitcoin futures ETF, which led to an explosion in buy-side orders. All the media attention around BTC, had a positive spillover effect on most other major cryptocurrency prices as well.
Bitcoin price sets new target at $100,000
Bitcoin (BTC) price was in the spotlight again yesterday after the launch of the first U.S. Bitcoin futures ETF generated quite a lot of buy-side volume. Although BTC price has taken a breather after profit-taking today, expect this rally not to be over yet as the media attention from past days is only likely to attract more and more buyers..
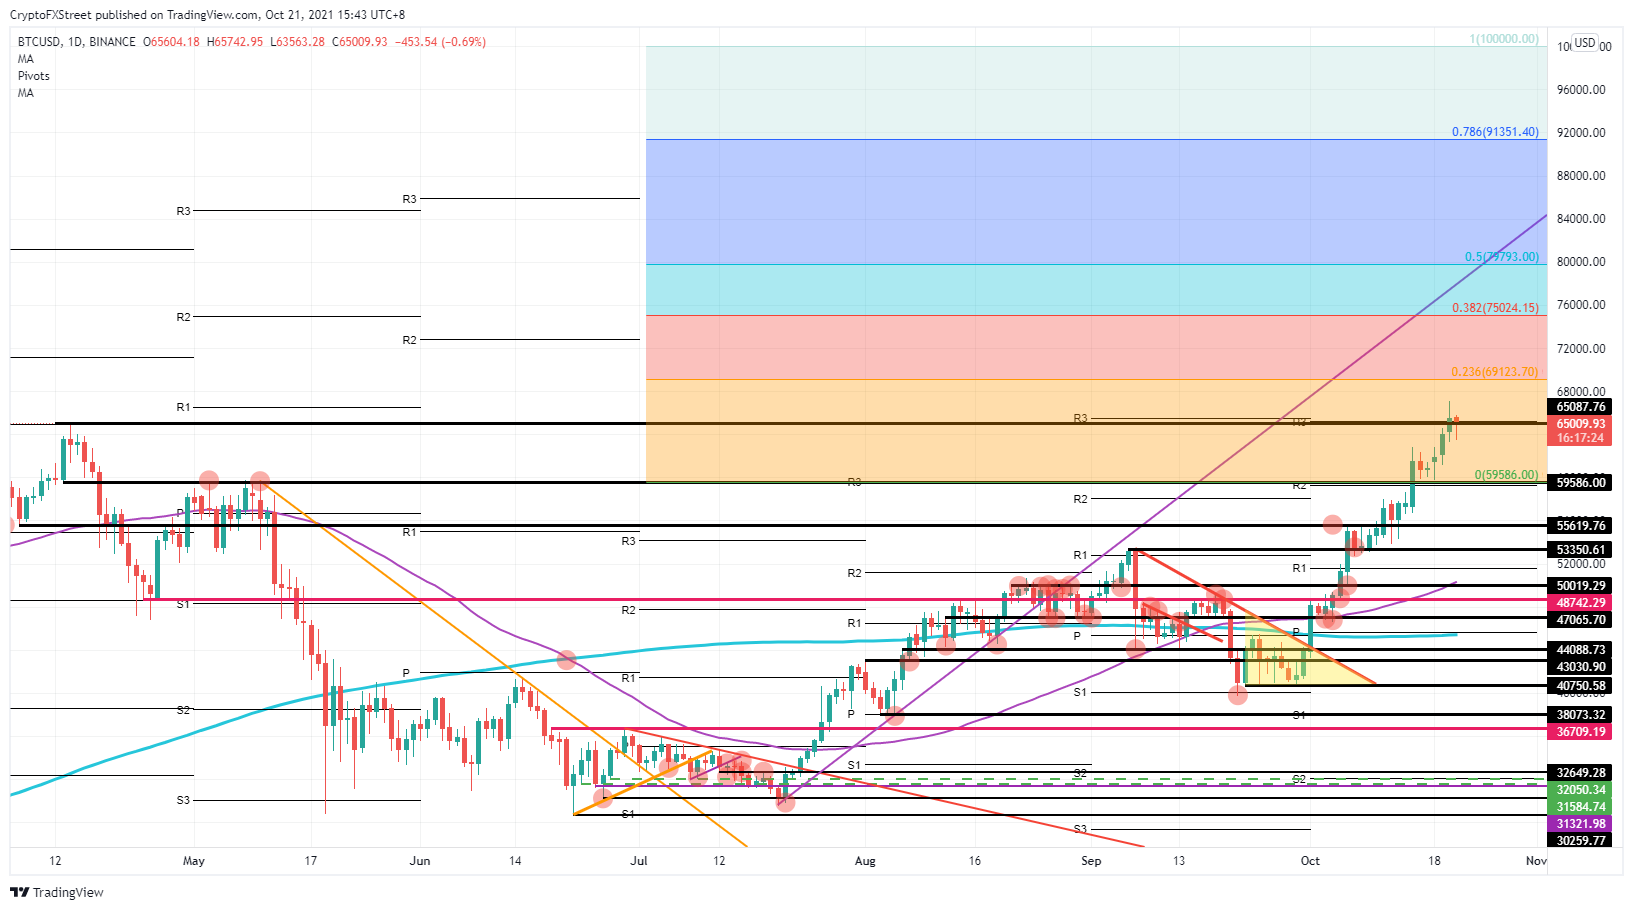
BTC price will probably first undergo a short correction and come off the all-time highs. The first level of support, providing an excellent entry-level for a long, will be around $59,586. This support level comes from the double top formed in May as well as the clear break-and-retest on October 15. From there, the first target will be the current all-time high at $67,176.
Once Bitcoin price can steam through there, the first resistance level will be around $69,123, which falls in line with the 23.6% Fibonacci level from the Fibonacci retracement between $100K $59,586. Expect that with the favorable tailwinds currently active in cryptocurrencies, the 23.6% ($69,123) and the 38.2% ($75,024) are unlikely to provide much resistance to Bitcoin bulls. The more significant issue will be the 50% retracement level at $79.793, which lies just below $80,000 and will see quite some profit-taking because of the psychological element.
Any further catalysts coming from positive media attention or current favorable tailwinds spiraling into further upside will be a necessary factor for attracting fresh buy-side volume into Bitcoin price. This will be necessary to cover the last piece of ground between $80.000 and $100.000.
BTC/USD daily chart
Should market sentiment turn to the downside and positive news headlines start to fade quickly as Bitcoin makes no new highs, expect a break of the support at $59,586. A leg lower would see $53,350 come into view, but with that level, many bulls will want to flee and lock in as much profit as possible. This could trigger a sell-off that could push BTC price back sub $50,000 towards $48,742.
Ethereum price to hit new all-time highs soon
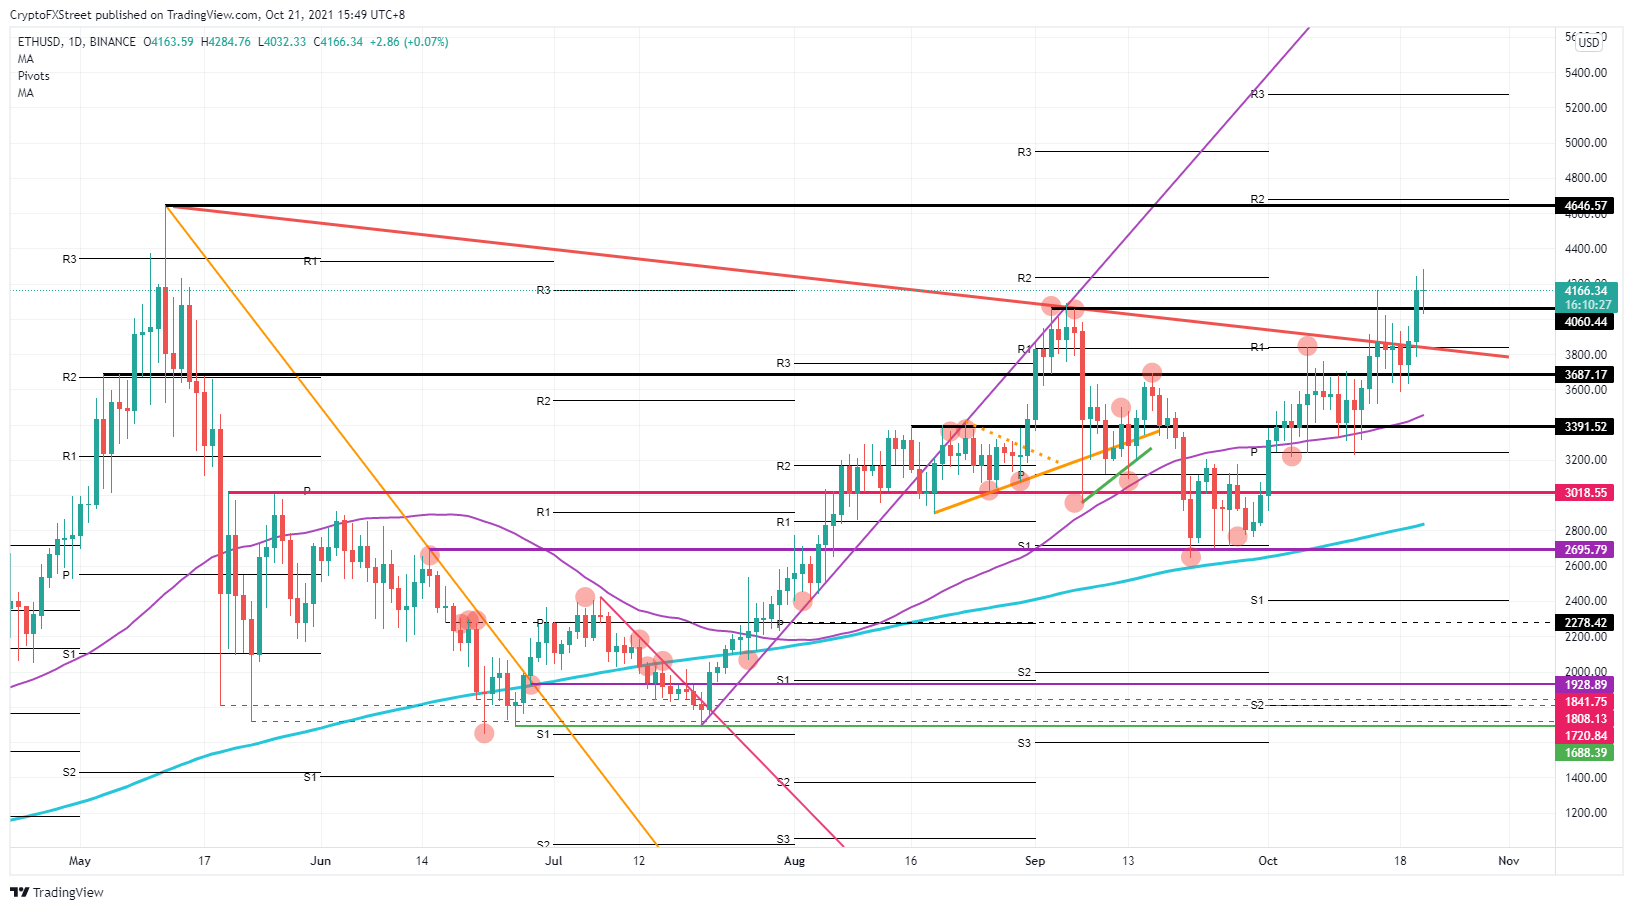
Ethereum (ETH) price has seen bulls coming in yesterday, helped by the positive spillover effect from Bitcoin. Bulls in ETH already tried a few attempts to break the descending top line, keeping further upside limited, however, yesterday bulls had enough volume and the right market sentiment to break firmly above and consolidate.
ETH price already tested support at $4,060 and saw even more buyers enter, adding volume to the bull run to cover the last piece of ground towards $4,646. As the favorable tailwinds and spillover effects from Bitcoin are still present, expect Ethereum price to hit new all-time highs either today or at least by the end of the week.
ETH/USD daily chart
That said, expect to see quite some profit-taking around the new high, as the monthly R2 resistance level will show some heavy resistance to bulls and this will probably lead ETH price to fade back towards $4,060. If market sentiment shifts further to the downside, for example – if Bitcoin cannot make new all-time highs or global markets start to worry about inflation again – expect a further dip below $4,060 towards $3,391. This level will be defended by plenty of bulls as it has already shown it is pivotal in deciding if ETH price is in an uptrend or downtrend.
XRP price unaffected by the tailwinds
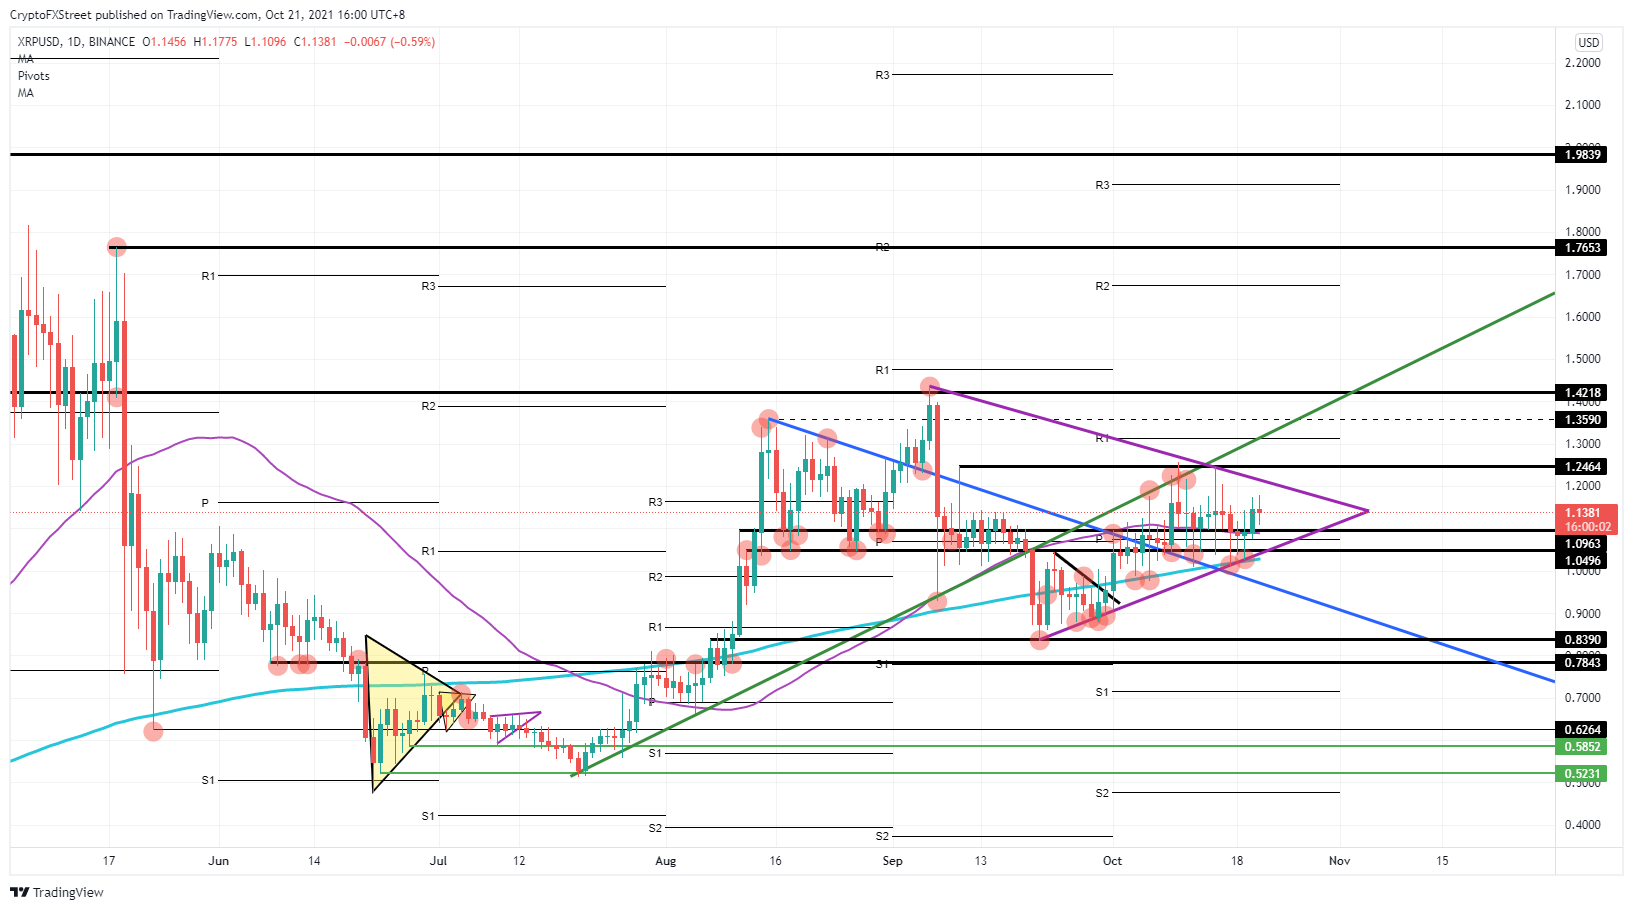
Ripple (XRP) price looks to be unaffected by any of the events going on in the cryptocurrency market. All the media attention and favorable tailwinds that came from the Bitcoin ETF news had no real impact on Ripple’s price action. Instead, neither bulls nor bears are showing their hand, and it looks like both parties are happy to let the pennant run its course until it breaks out either way.
XRP price has been stuck in a pennant pattern since mid-September, and although a lot of tests have been to the downside, bulls look to keep defending the ascending trend line, which might tilt this pennant towards a more bullish breakout as an outcome. On the other hand, bears have perfectly defended $1.25 with rejection on both the descending trend line of the pennant and that short-term trend line acting as resistance from September 10.
XRP/USD daily chart
There is more possibility of a bullish outbreak than a bearish one, as bulls have had quite a lot more entry levels against that ascending trend line. A breakout higher would first see $1.25 met and then $1.42. From there, it is quite a long way to $1.76, so XRP price would undoubtedly need some outside help from a catalyst or favorable tailwind that could help lift the trade.
In case market sentiment overall shifts back to risk-off, expect the pennant to break to the downside and see bears break back below the blue descending trend line near $0.84. A retest at $0.78 would be possible, but a break lower is more unlikely as bulls will want to defend this support as a signal for keeping their uptrend intact.
[ad_2]


