[ad_1]
Yesterday we saw some bullish price action in the cryptocurrency market. It followed the bullish reversal during the weekend, with Bitcoin leading the way after Elon Musk’s comments, climbing above $40,000 for the first time in nearly three weeks.
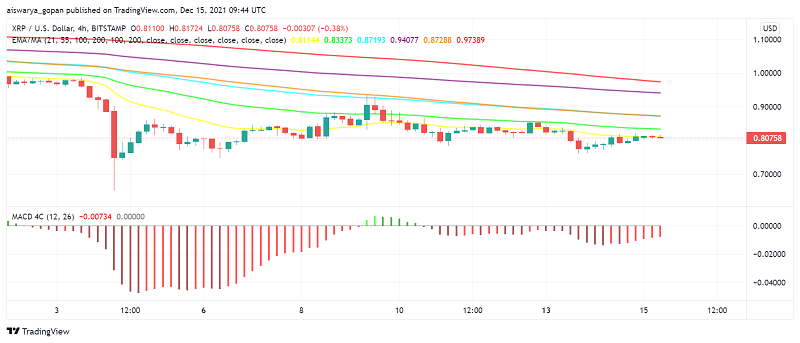
Ripple took advantage of the bullish sentiment in the crypto market, increasing from 0.80 to 0.92. But, the charts don’t look too promising now, as XRP/USD is retreating back down. On the daily chart, Ripple is finding support at the 200 SMA (purple) at the bottom, but at the top the 20 SMA (gray) is providing resistance.
XRP/USD
This moving average has been ending the bullish attempts since the beginning on June, pushing them down every time. So, the highs have been getting lower for Ripple, which is not a good sign for buyers, since it means that the pressure is on the downside.
The lows are staying around the same level at $0.80 in fact. Yesterday, buyers failed to push above the 20 daily SMA once again and the price formed a doji candlestick, which is a bearish reversing signal.

The 100 SMA is acting as resistance for Ripple
If we switch to the H4 chart above, we can see that here it has been the 100 SMA (green) which has been acting as the ultimate resistance since early this month. Yesterday, buyers failed to push above the 100 SMA and today we are seeing a slight pullback.
So, both charts are pointing to a bearish reversal for Ripple coin, but the reversal seems too slow today, which suggests that the lowers MAs might turn into support on the H4 chart. Well, the climb has stopped for now, but let’s hope that the retreat remains weak and buyers come back again, pushing the price above the MAs which are working as resistance and resuming this year’s bullish trend. For the moment though, Ripple looks vulnerable.
[ad_2]

