[ad_1]
- XRP/USD battles 50-day SMA during a corrective pullback from the lowest in one week.
- Momentum indicator, two-month-old support line suggests consolidation of recent losses.
- 100-day SMA, yearly support line add to the downside filters.
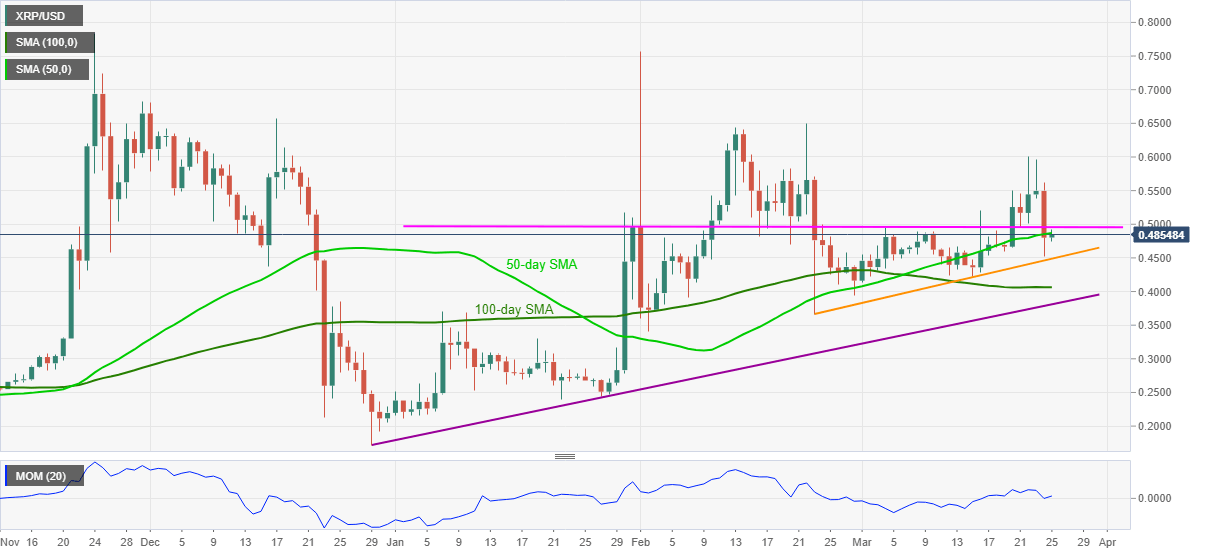
Ripple picks up bids to $0.4903, up nearly 2.0% intraday, during early Thursday. The altcoin dropped to the lowest since March 16 the previous day but bounced off before testing an ascending support line from February 23.
Given the upward sloping momentum indicators and the quote’s sustained trading beyond a short-term support line, XRP/USD buyers pierce 50-day SMA. However, the pair’s further upside needs to provide a decisive closing beyond the two-month-old horizontal line surrounding $0.4950 to offer confirmation of an extra run-up.
During Ripple’s rally beyond $0.4950, the mid-March top around $0.5200 and the monthly peak close to $0.6000 will be crucial to watch.
Meanwhile, extended failures to regain past-50-day SMA level of $0.4870 can keep fears of breaking the stated support line, at $0.4488 by the press time.
In a case where XRP/USD drops below $0.4488 on a daily closing basis, 100-day SMA and a bit broader support line from December 29, 2020, respectively around 0.4065 and $0.3800, will be in the spotlight.
XRP/USD daily chart
Trend: Further recovery expected
[ad_2]


