[ad_1]
- Bitcoin is getting ready for an upswing above $60,000 after the TD Sequential indicator presented a buy signal.
- Ethereum’s uptrend to $2,000 depends on the bulls’ ability to cut through $1,800.
- Ripple sets the pace for recovery after lifting above a symmetrical triangle pattern.
Cryptocurrencies seem to have engaged thrust reverses amid the bull run, perhaps to take a breather. Bitcoin was purged from highs above $61,000 on Monday in the declines that affected almost the entire market.
The cryptocurrency market is mainly painted red apart from selected altcoins like XRP (up 8.6%), Terra (up 24%), NEM (up 9%), and Huobi Token (up 6%). On the other hand, Ethereum is attempting to reclaim the ground above $1,800 to pave the way for gains eyeing $2,000.
Bitcoin bulls look forward to liftoff beyond $60,000
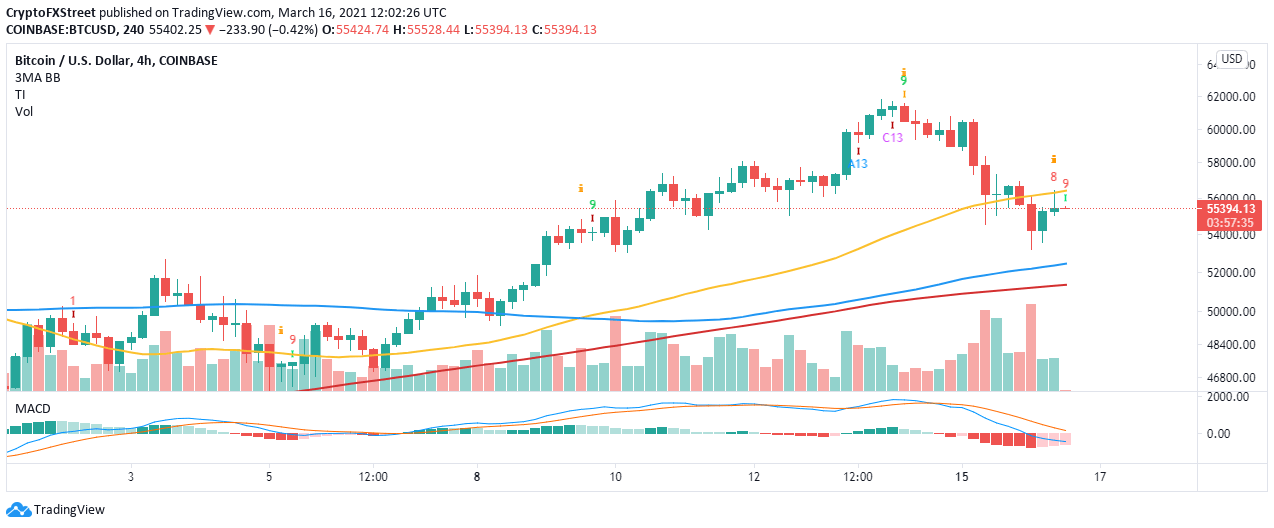
The bellwether cryptocurrency appears to have secured support at $54,000, leading to gains past $55,000. BTC’s immediate upside has been capped under 50 Simple Moving Average (SMA). Trading above $56,000 and by extension, the 50 SMA would call out to the investors at the sidelines to return to the market. If massive buy orders are triggered, Bitcoin will shift attention to $60,000.
The TD Sequential indicator has flashed a buy signal on the 4-hour chart, thus validating the potential upswing. An increase in buy volume will most likely catapult Bitcoin above $60,000.
BTC/USD 4-hour chart
On the flip side, the Moving Average Convergence Divergence (MACD) reveals that Bitcoin is not out of the woods yet. As long as the indicator is in the negative region, bulls will struggle with sustaining the uptrend.
Ethereum uphill battle as seller congestion intensifies
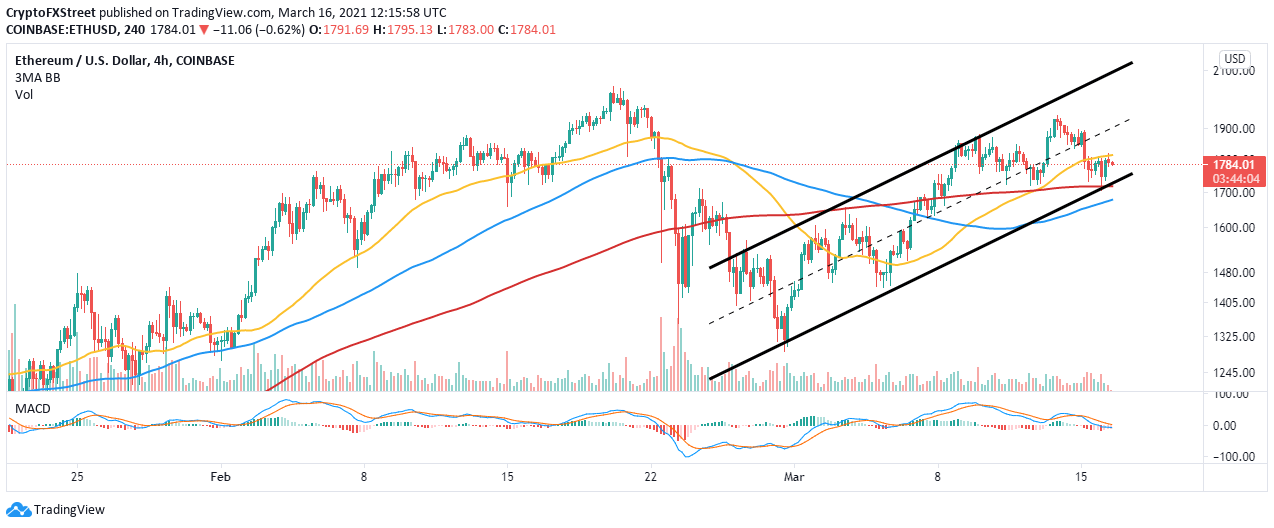
Ethereum is banking on overcoming the resistance at $1,800 and the 50 SMA to add credibility to the upswing. Meanwhile, Ether is trading at $1,793 amid the push for higher intraday highs.
The MACD is likely to flip bullish in the coming sessions, adding weight to the positive outlook. Trading above the ascending channel’s middle resistance would be a huge signal for gains past toward $2,000.
ETH/USD 4-hour chart
It is worth noting that Ethereum may continue with the downtrend if the resistance at $1,800 remains intact. On the downside, support is available at the 200 SMA, reinforced by the channel’s lower edge. If it breaks, Ether will freefall under $1,700 in search for another anchor, perhaps at $1,600.
Ripple sets out for a 34% uplift
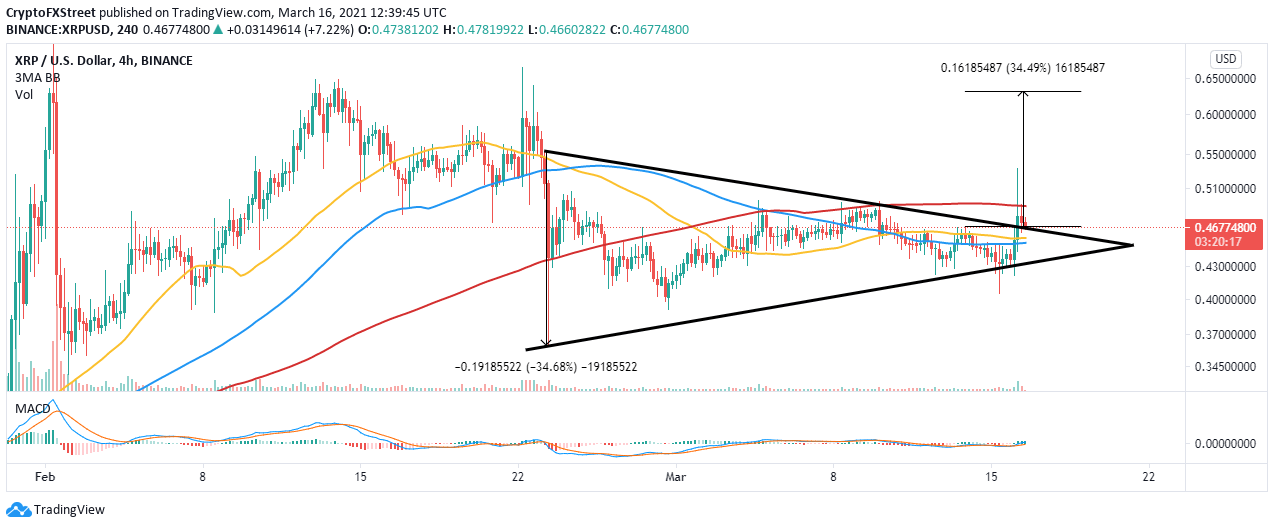
XRP is among the few cryptocurrencies in the green on Tuesday. A recent breakout from a symmetrical triangle pattern briefly stepped above $0.5 but hit a snag at $0.53.
In the meantime, XRP is back to trading under $0.5 with a market value of $0.47. The triangle pattern hints at a possible 24% upswing as long as bulls can reclaim the ground above $0.5 as well as the 200 SMA.
The MACD has a bullish impulse, as observed on the 4-hour chart. This indicator calculates the momentum of an asset and follows its direction. As the MACD slices into the positive region, more investors are encouraged to increase their risk appetite, thereby adding to the buying pressure.
XRP/USD 4-hour chart
It is worth mentioning that the bullish outlook may fail to occur if the resistance at $0.5 remains intact. On the other hand, return into the triangle pattern may open the Pandora box, leaving XRP vulnerable to a 34% downswing. However, the 50 SMA and the 100 SMA will function as support areas to prevent losses toward $0.36.
[ad_2]


