[ad_1]
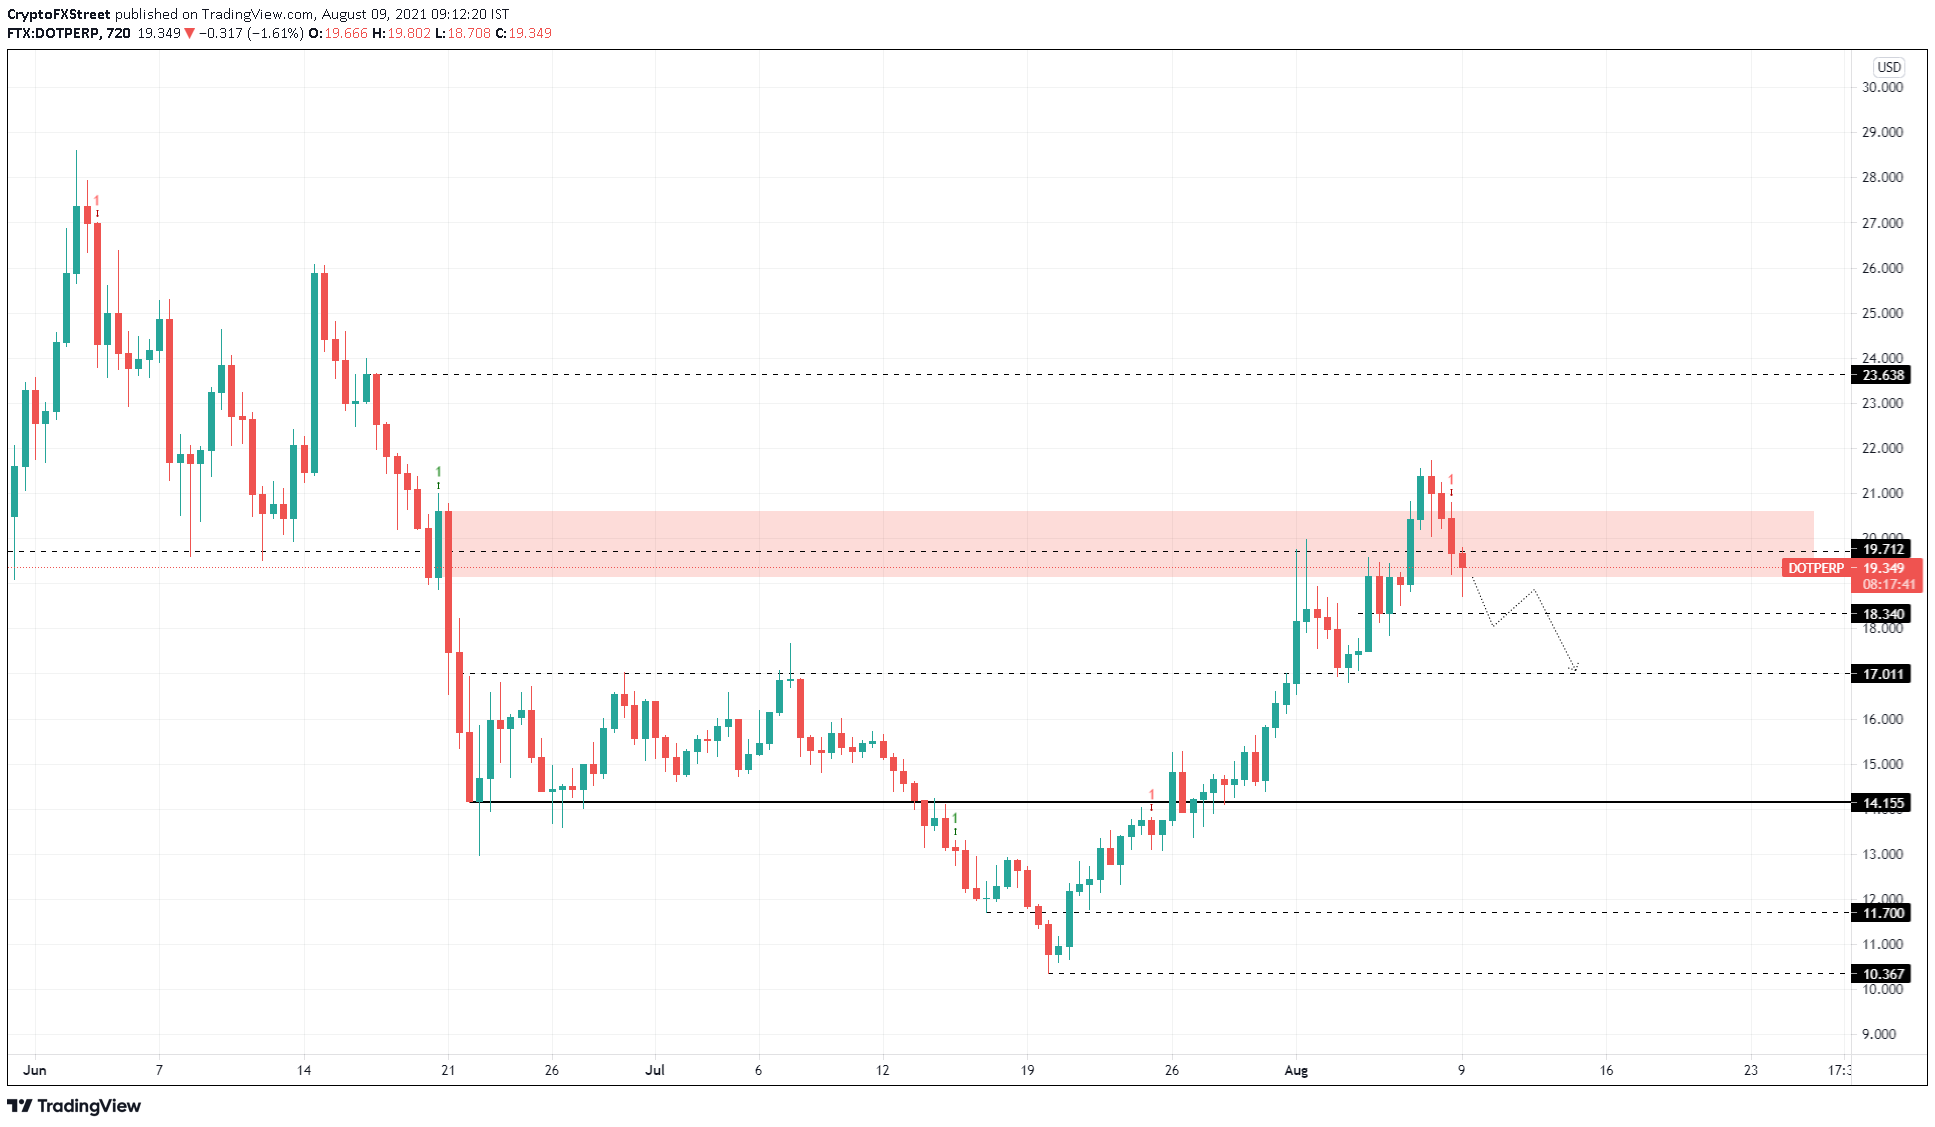
- Polkadot price is undergoing a retracement after it failed to hold above a supply zone, ranging from $19.14 to $20.61.
- The co-founder mentions that they have recently deployed six parachains, and their effects will be apparent in the near future.
- A resurgence of buyers that flip the said supply zone into a demand area will invalidate the bearish thesis.
Polkadot price is rallied exponentially from July 20 to August 8, but things took a turn as the cryptocurrency market began to reverse. In addition to the overall selling pressure, a technical indicator flashed a sell signal, further exacerbating the descent.
Early days in the Polkadot land
Referring to the 2020 DeFi Summer and multiple blockchains like Aave, Sushi, and others that took off, Polkadot co-founder Rob Habermeier explained during an interview with The Scoop that Polkadot is still in the early stages.
He explains that Polkadot recently launched the first version of parachains on the Kusama Network. Unlike many blockchains, Polkadot establishes application-specific data structures, known as parachains, that can focus on a specific industry sector.
Touching more on the topic, Habermeier added,
There are six parachains deployed on the Kusama network. Those are focusing on DeFi, smart contracts, Layer 2 scaling, identity secure compute (which) are some of the first projects we are starting to see emerge on Polkadot.
Since the “parachain season is just beginning, the co-founder expects these projects to have their community and grow as time progresses and even have applications built on top of them.
Polkadot price needs to find stable grounds
Polkadot price rallied roughly 110% between July 20 and August 8. After piercing the supply zone ranging from $19.14 to $20.61, and setting up a swing high at $21.72, DOT has dropped 13%.
This descent has pushed Polkadot price below the said area of resistance, which is a bearish sign. While the downswing was evident after such a massive uptrend, investors can expect it to extend lower, especially since the Momentum Reversal Indicator (MRI) has flashed a sell signal in the form of a red ‘one’ candlestick on the 12-hour chart. This setup often forecasts a one-to-four candlestick correction.
The immediate support level at $18.34 is the first level sellers will encounter. Breaching $18.34 will push DOT down to $17.01, roughly 12% from the current position, $19.34.
Although it is unsure if the sell-off will continue after $17.01 if the recent upswing was a shift in the narrative to bullish, investors can expect an upswing to originate here.
DOT/USDT 12-hour chart
Regardless of the bearish pressure, if the buyers make a comeback pushing Polkadot price above the supply zone’s upper limit at $19.14, it will indicate that an upswing is likely to survive.
A confirmation of the bullish outlook will arrive after the DOT produces a bounce off the $19.14 barrier. If this were to occur, market participants could expect a 15% ascent to $23.666.
[ad_2]


