[ad_1]

Several cryptocurrencies are trading at important price levels. Those price levels, and how traders respond to them, will dictate what kind of direction we will likely see the market move over the remainder of the week.
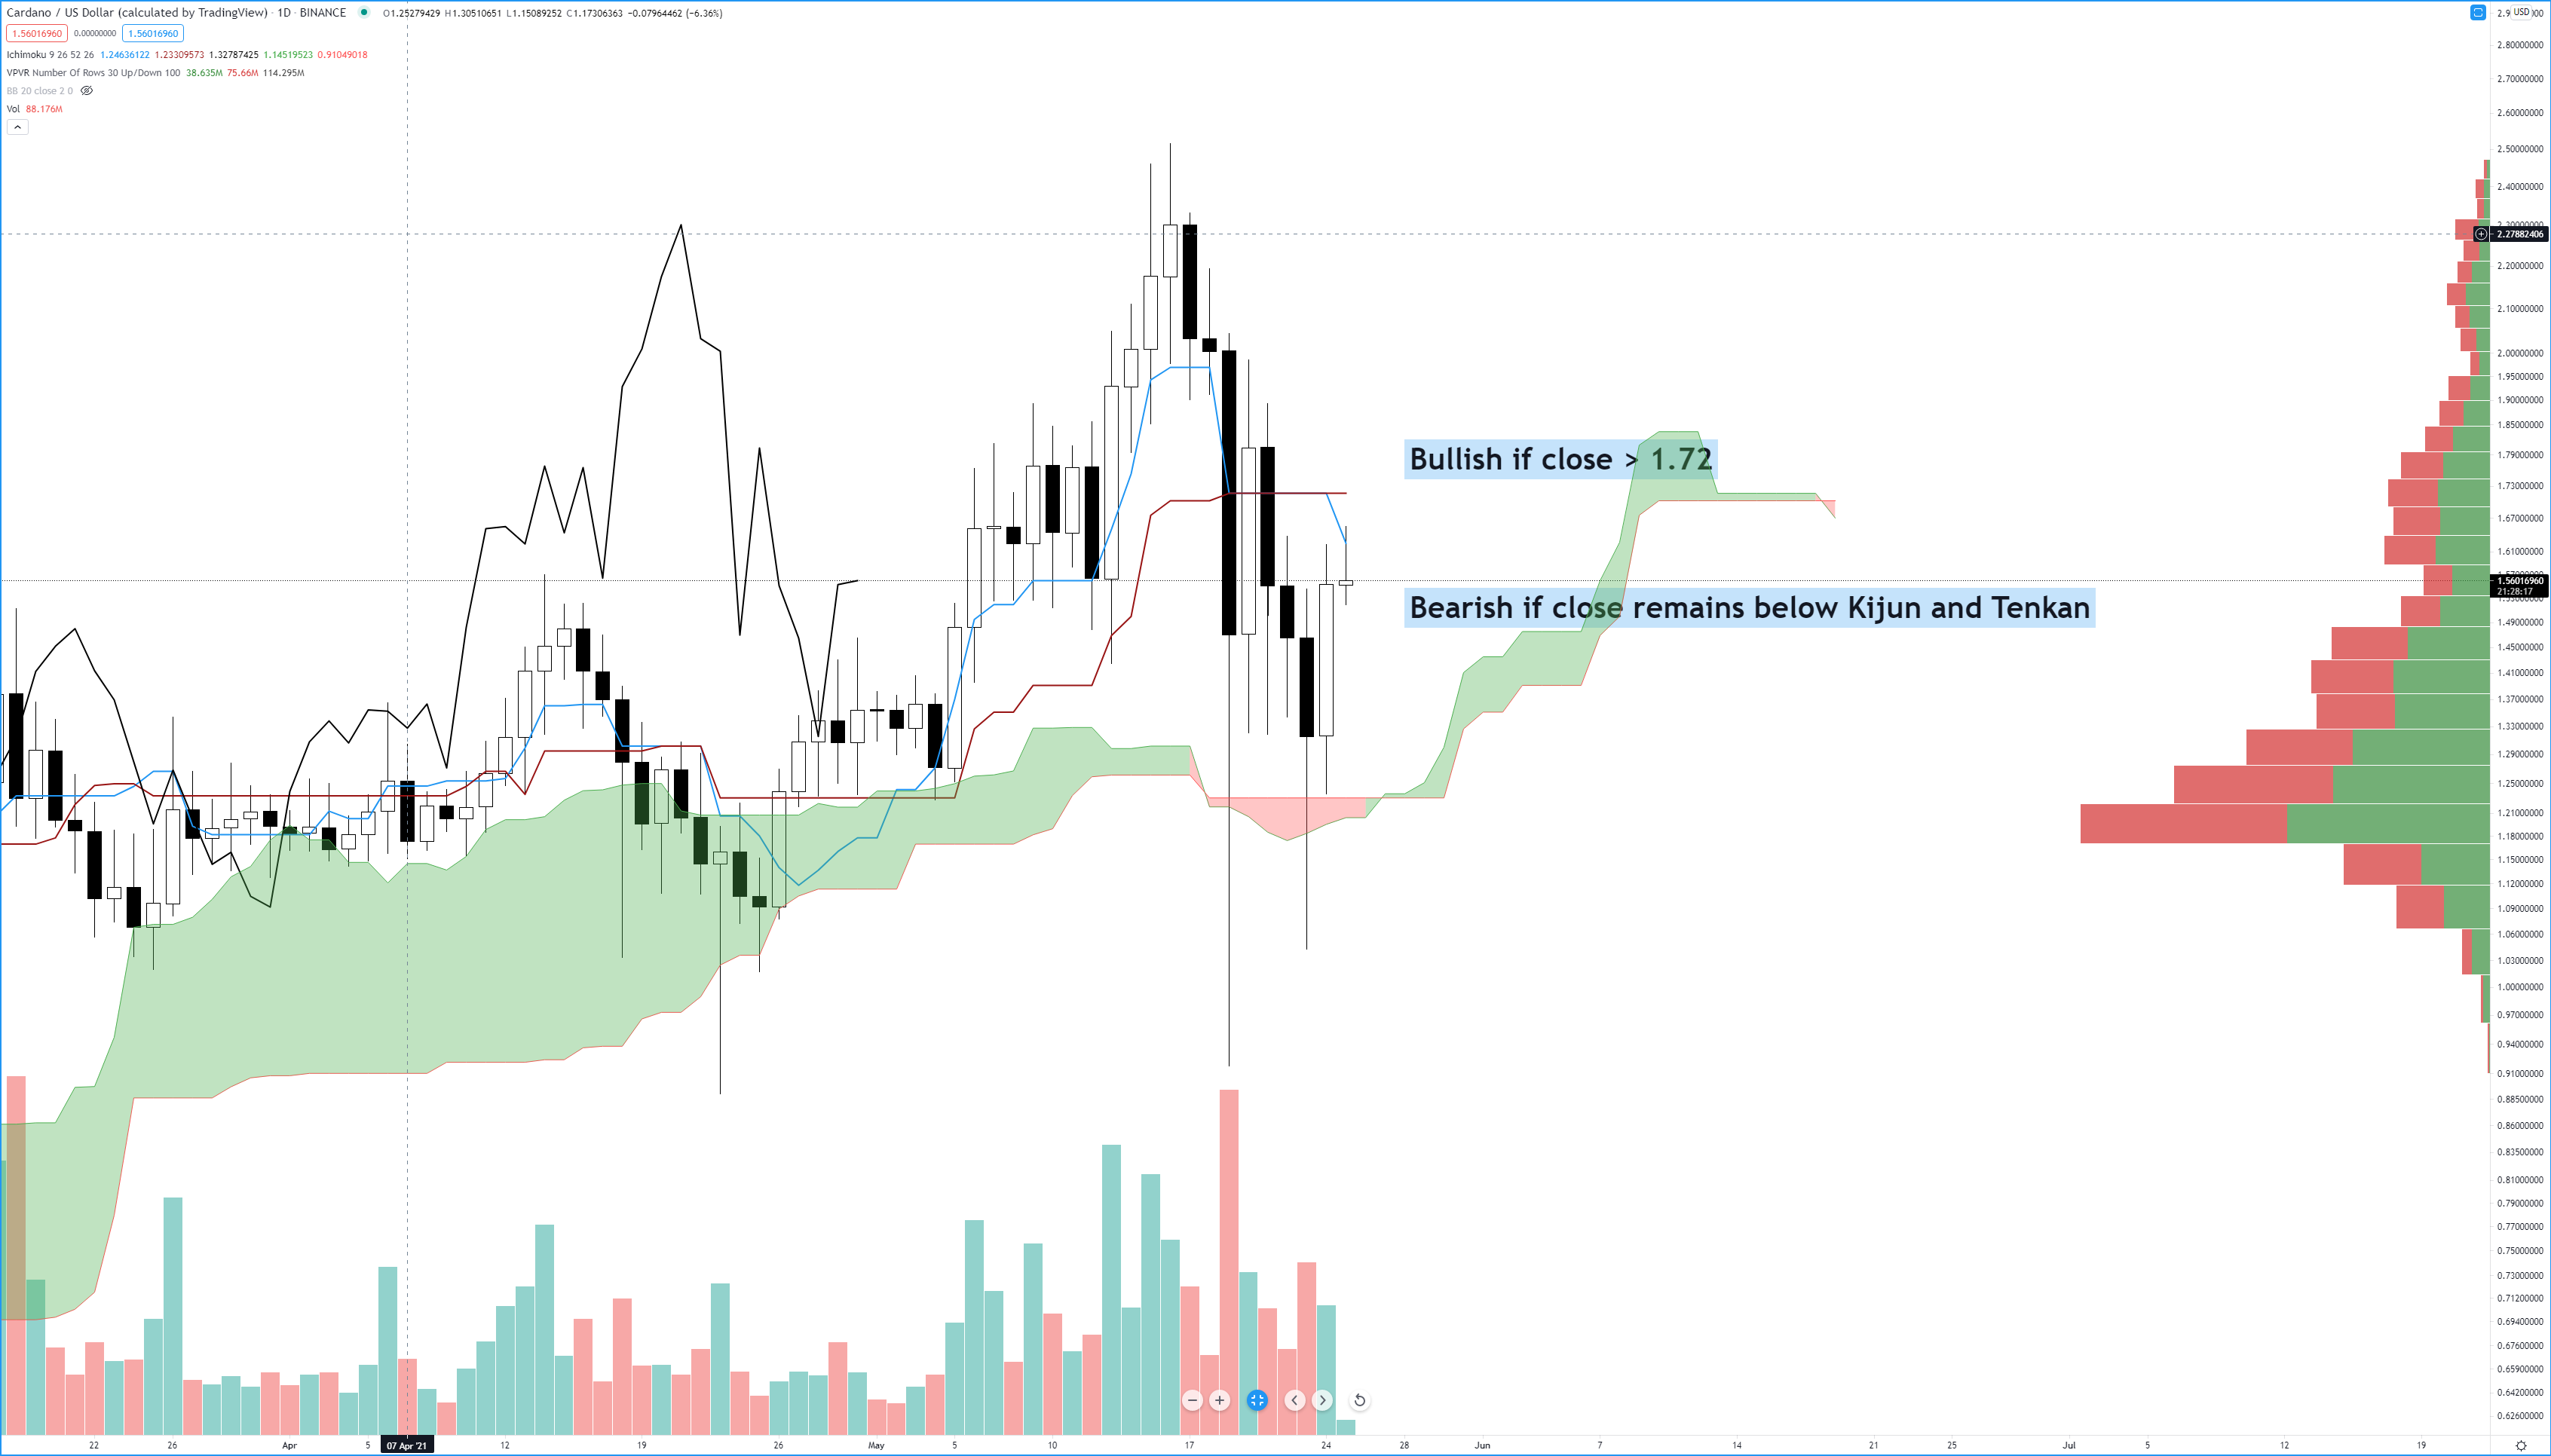
Cardano (ADAUSD)
Above: Cardano (ADAUSD) Weekly Chart
Cardano is trading at a precarious level. While Monday’s close was bullish, the volume was less than Sunday’s volume (a normal trading day having less volume than a weekend day is not good). I continue to see rejection higher as price pushes against the daily Tenkan-Sen at 1.63 and the Kijun-Sen at 1.7179. If we continue to see a series of closes on the daily chart below the Tenkan-Sen and Kijun-Sen, then we’re likely to continue our move south to possibly retest the 0.84 – 0.94 support zone. However, any strong bullish close above the Kijun-Sen and around the 1.72 value area would be bullish.
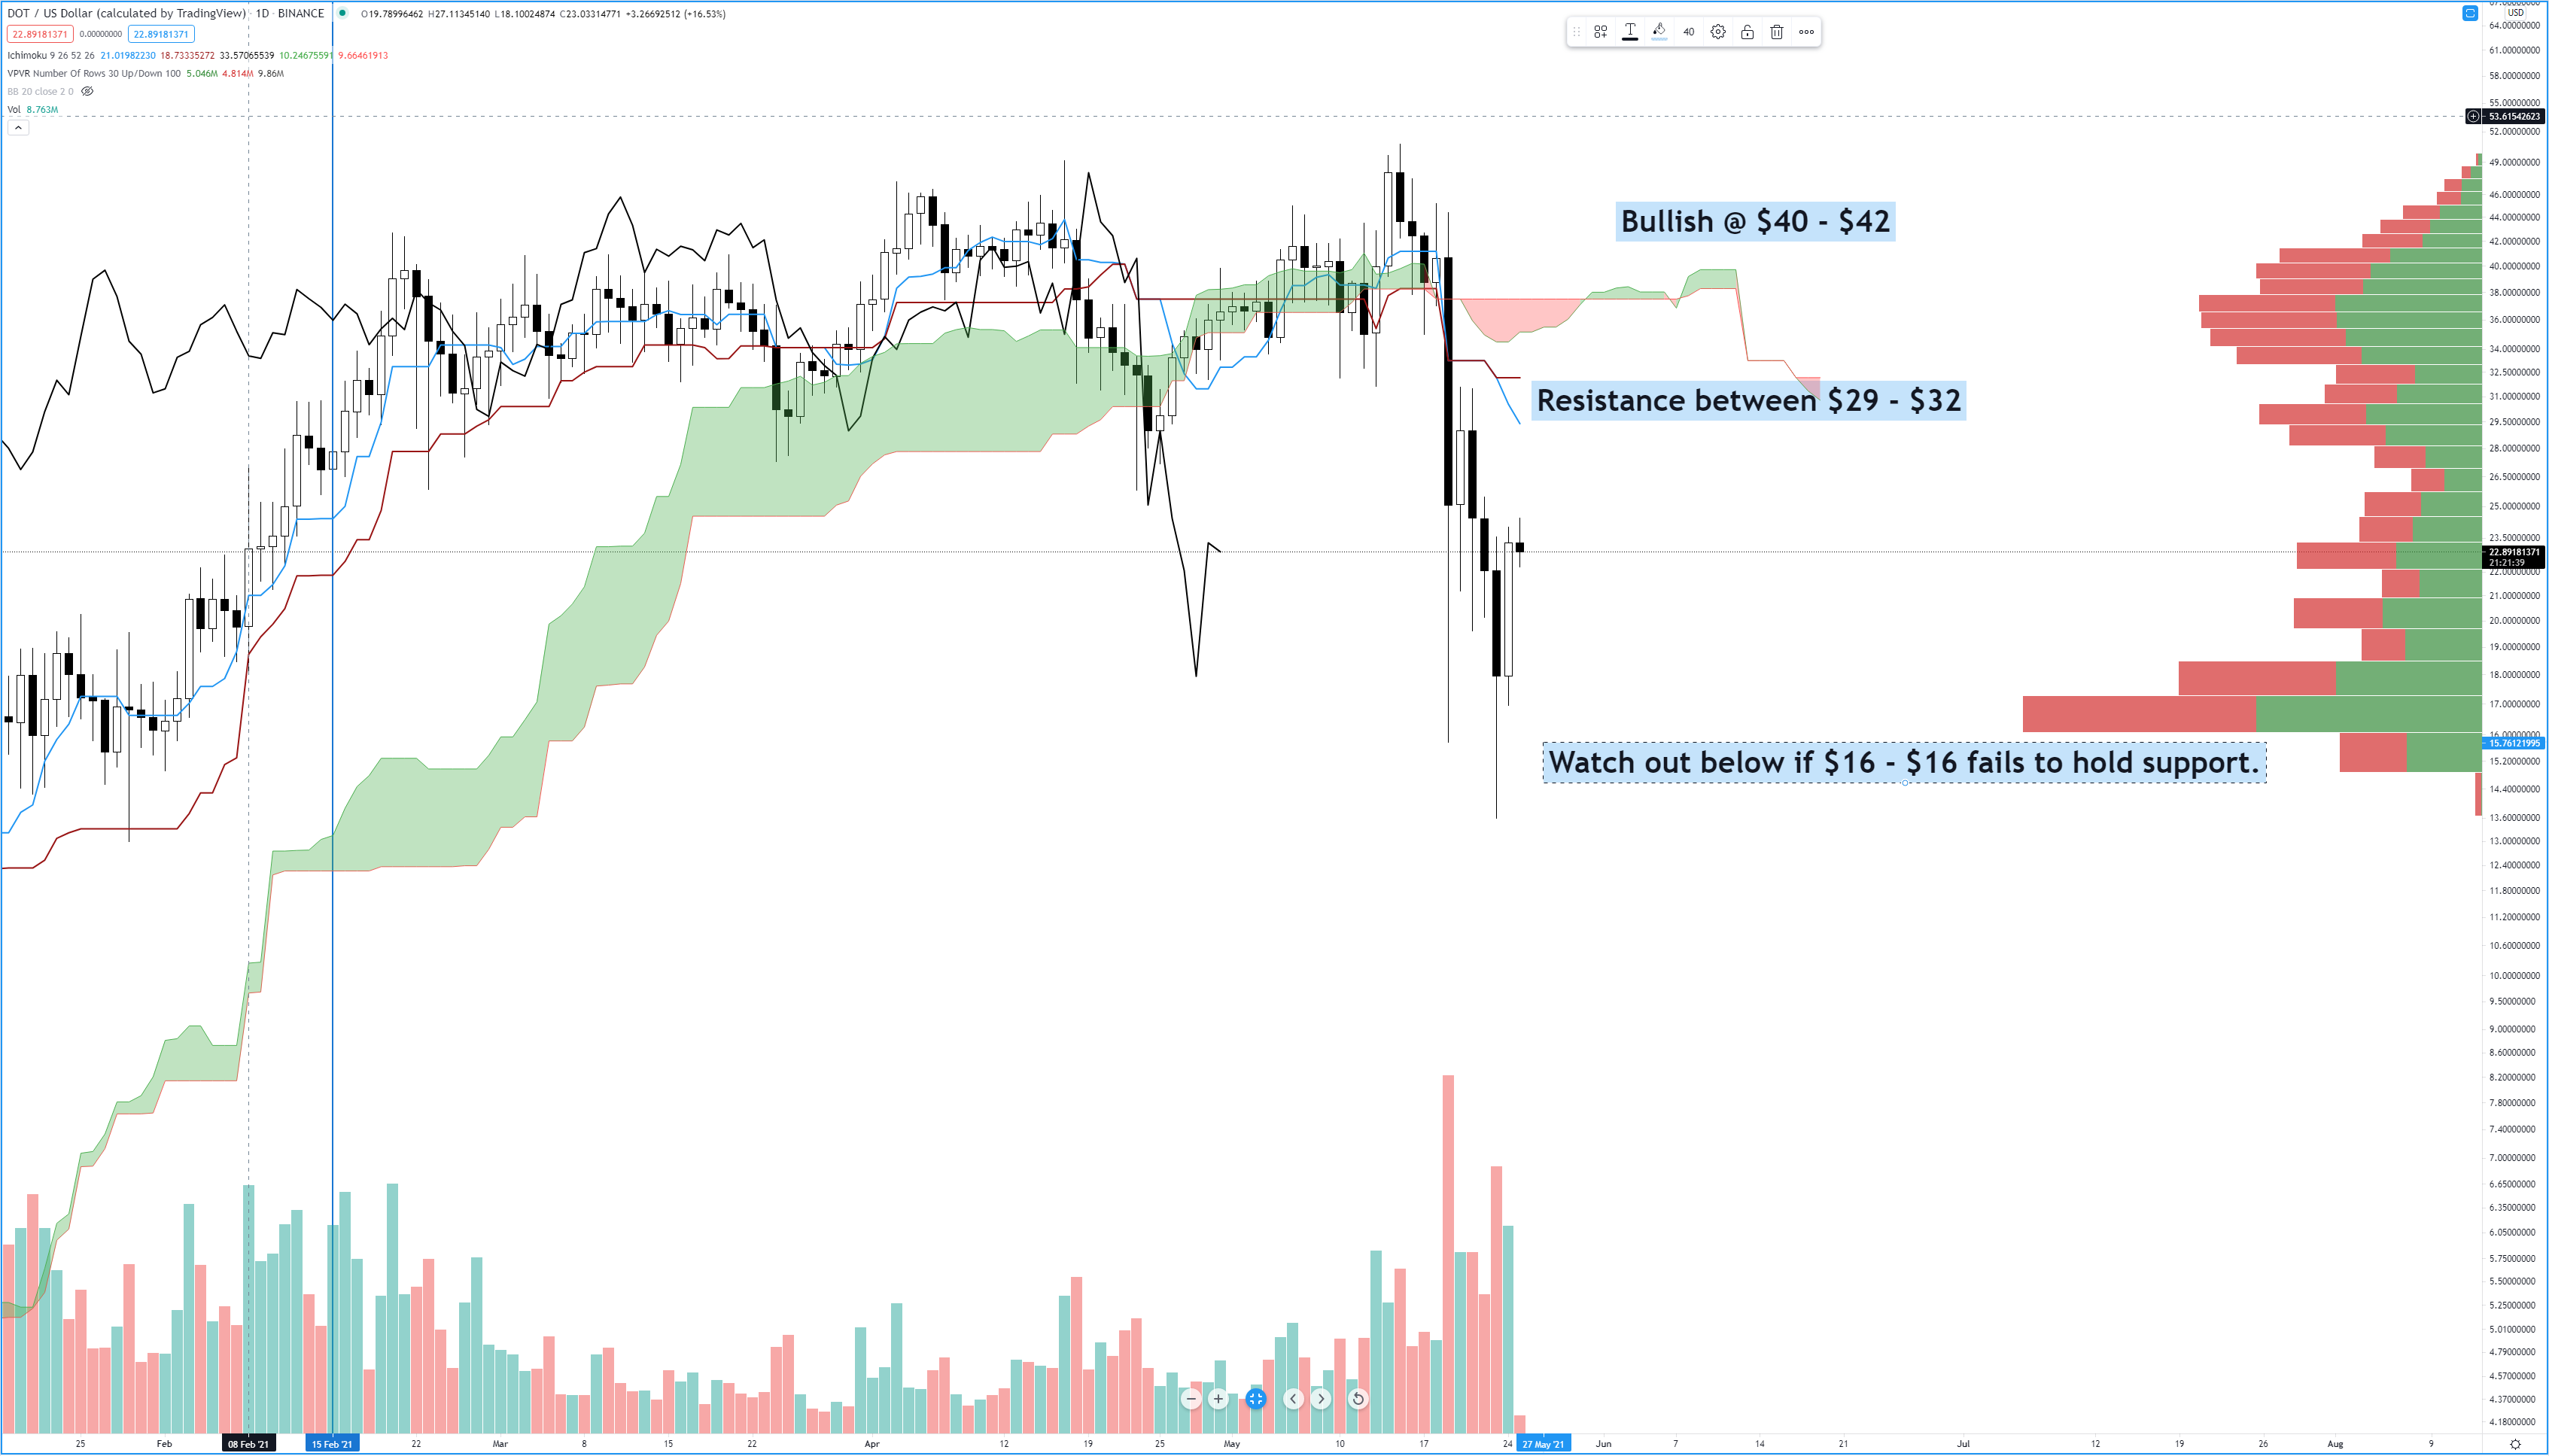
Polkadot (DOTUSD)
Above: Polkadot (DOTUSD) Daily Chart
Polkadot has sure had some violent drives lower over the past week. It’s lost as much as -73.22% from its all-time high and remains down -54.92% from the all-time high. While a short term bullish run towards the $30 value area would no doubt excite some longer-term holders of Polkadot, there is some stiff resistance ahead. Between the price levels of $29 and $32 are the Tenkan-Sen and Kijun-Sen. Above that, we have Cloud itself with a very long-lasting, flat Senkou Span B. Senkou Span B is the hardest level to cross within the Ichimoku system as it represents that strongest level of support/resistance. When we see long periods of the Senkou Span B trading flat, that increases the strength of that support/resistance. The current Senkou Span B is at $37.50 and will remain at this level until July 7th, 2021. I’m bullish if we get a close near the $40 value area because that would put price above the Cloud and the Chikou Span would be above the Cloud and the candlesticks. We’ve seen the $16 – $17 level hold as strong support, but watch out if it cracks, it’s a fast trip to $6 if bulls can’t hold at $16.
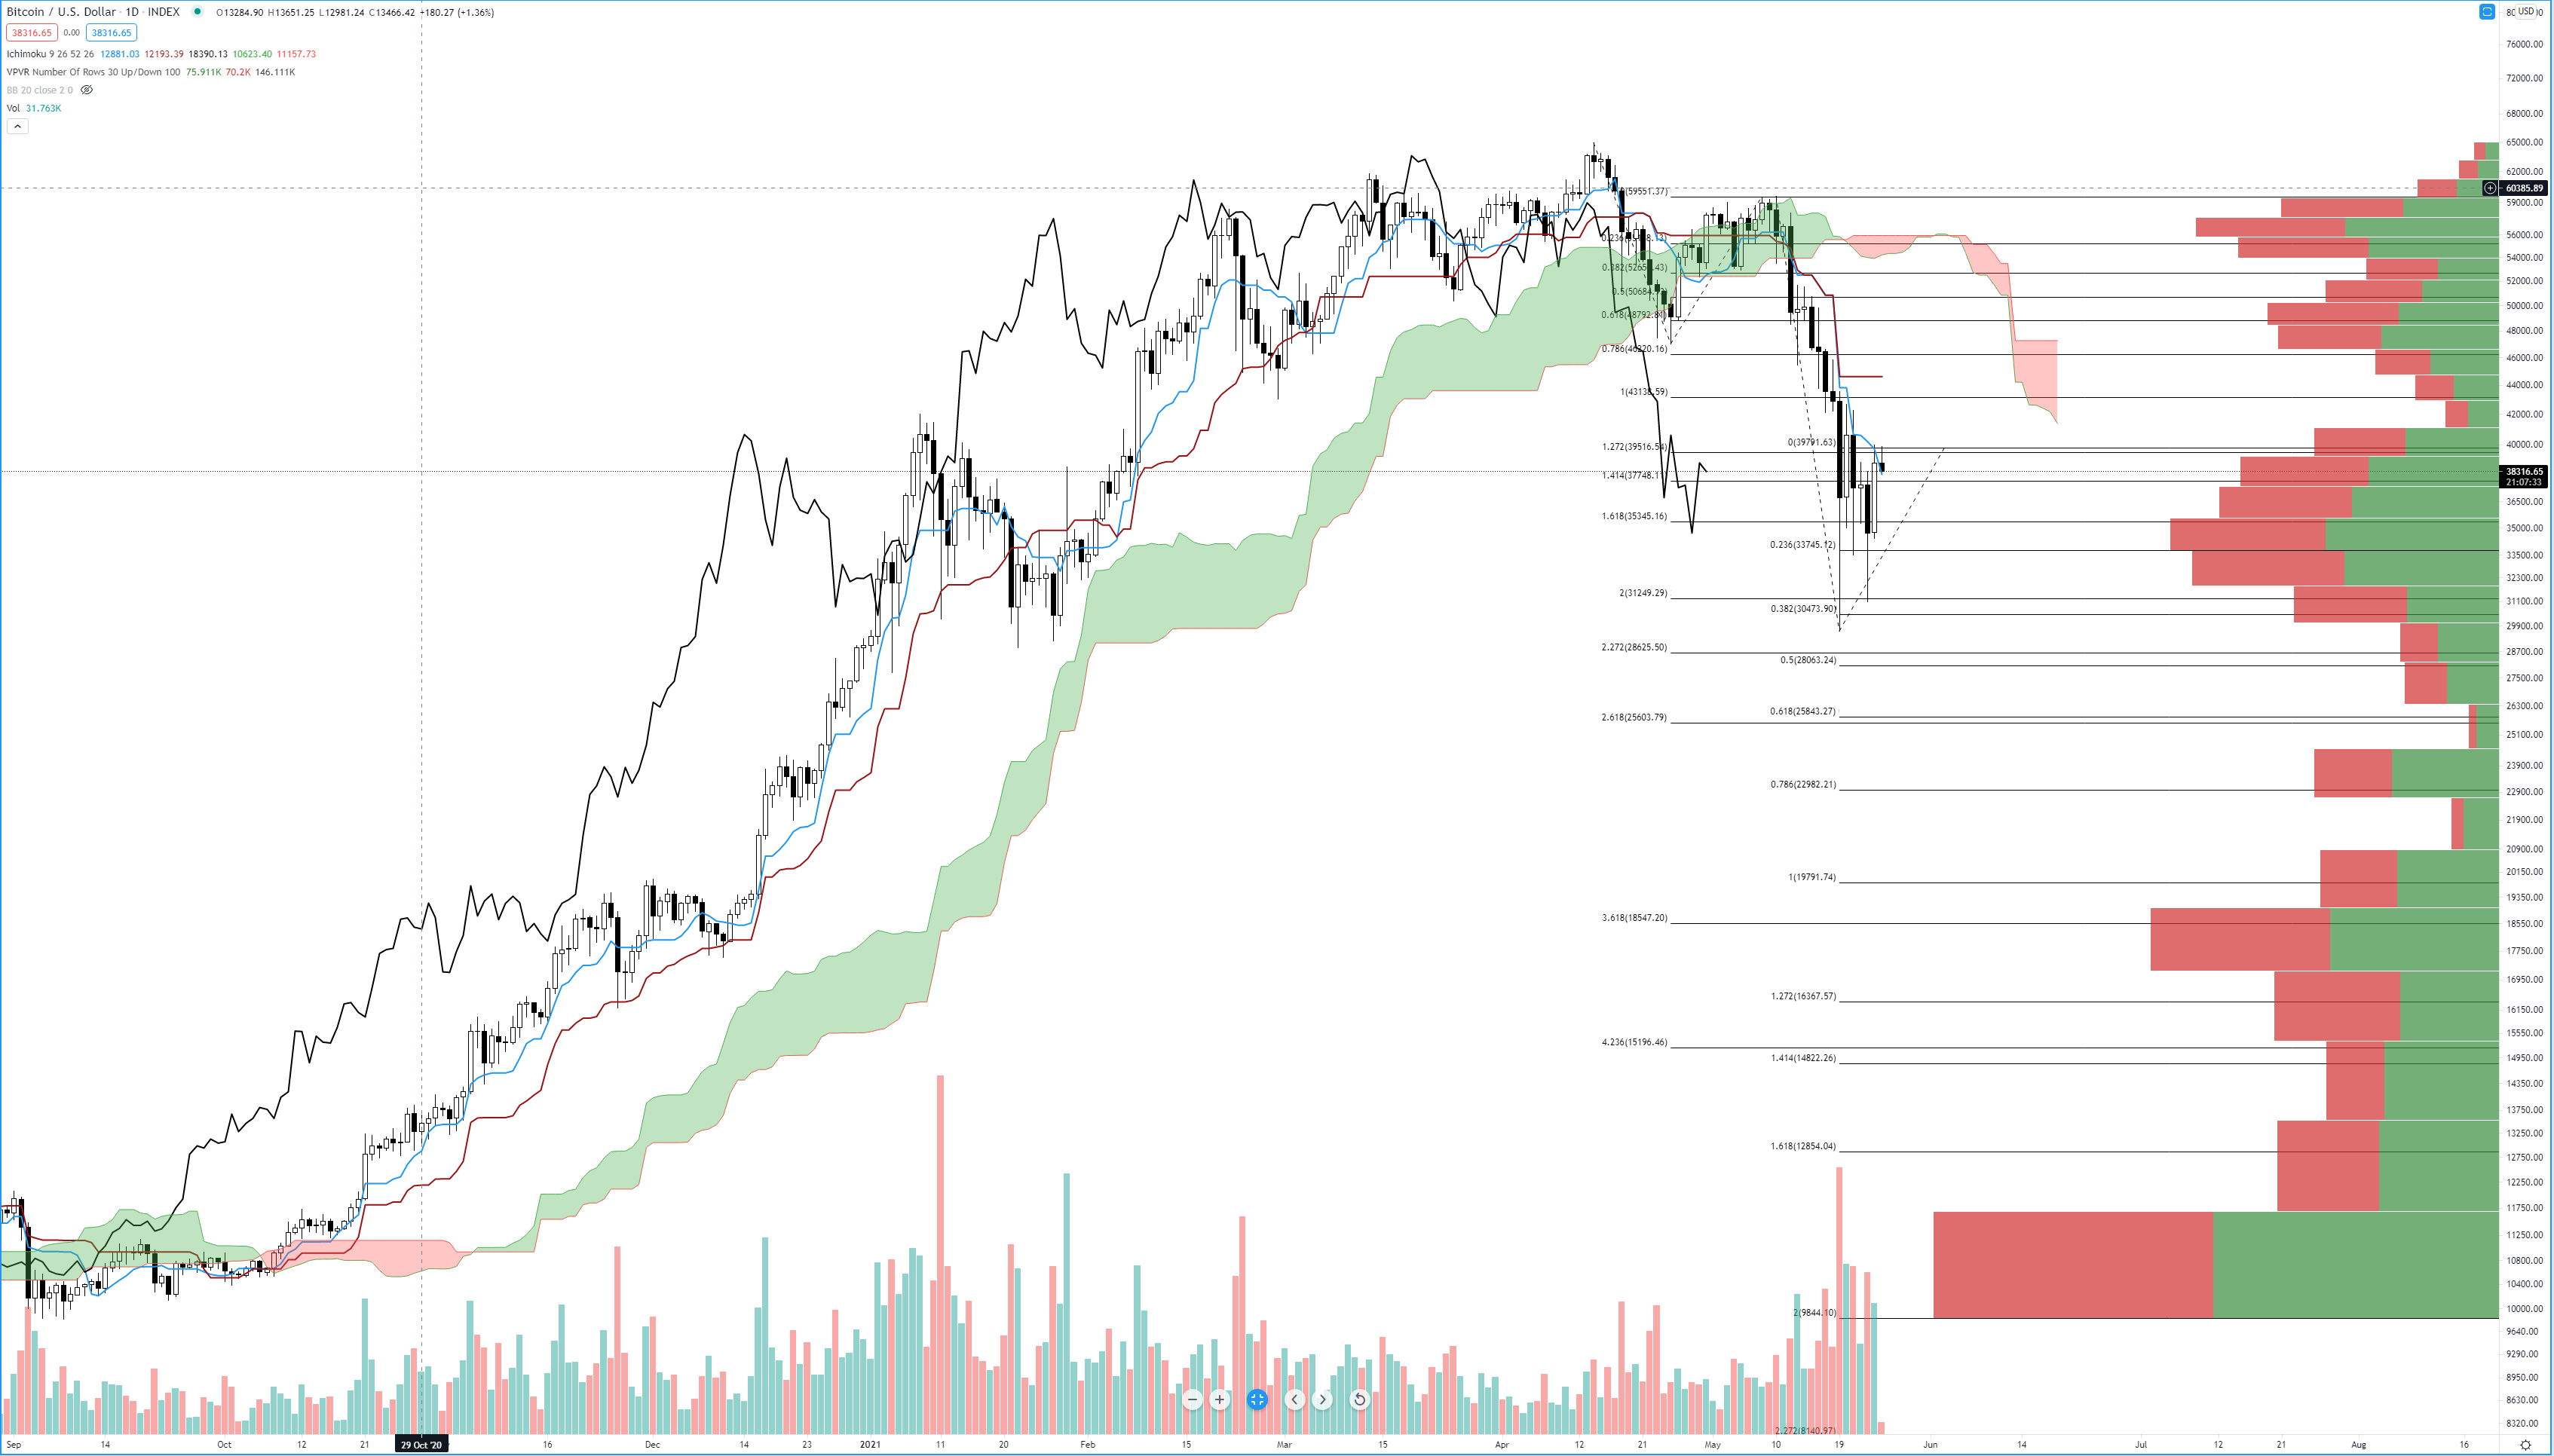
Bitcoin (BTCUSD)
Above: Bitcoin (BTCUSD) Daily Chart
Bitcoin is currently trading against a fairly large high volume node. The volume profile tells us that there is a lot of activity between $32k and $38k. Below $32k the volume profile things out considerably and we won’t see a high volume node appear until the $23.2k level. Just above the high volume node at $23.2k is the 261.8% Fibonacci Extension level at $25,603.79. Below that, the 361.8% Fibonacci Extension at 18,547.20 is also a high volume node. If we draw another Fibonacci Extension starting from the swing high on May 10th to the swing low on May 19th and then to the swing high at $40k from Monday, then we will see the 61.8% Fibonacci Extension is right on top of our prior 261.8% level. $25,600 appears to be the next strong support zone for Bitcoin – and I think a move down to this level is necessary. Why? Because Bitcoin has never tested the initial breakout of the $20k level. While it seems a little crazy to think that Bitcoin could test a level below the 30k range, it is very, very likely to do so.
Advertisement
Save money on your currency transfers with TorFX, voted International Money Transfer Provider of the Year 2016 – 2020. Their goal is to connect clients with ultra competitive exchange rates and a uniquely dedicated service whether they choose to trade online or over the telephone.
Find out more here.
[ad_2]


