[ad_1]

– Detailed technical analysis over Polkadot.
– Combinations of different technical analysis helps paint a broad picture.
Polkadot (DOT) Daily Ichimoku Chart Analysis
Above: Polkadot (DOT)
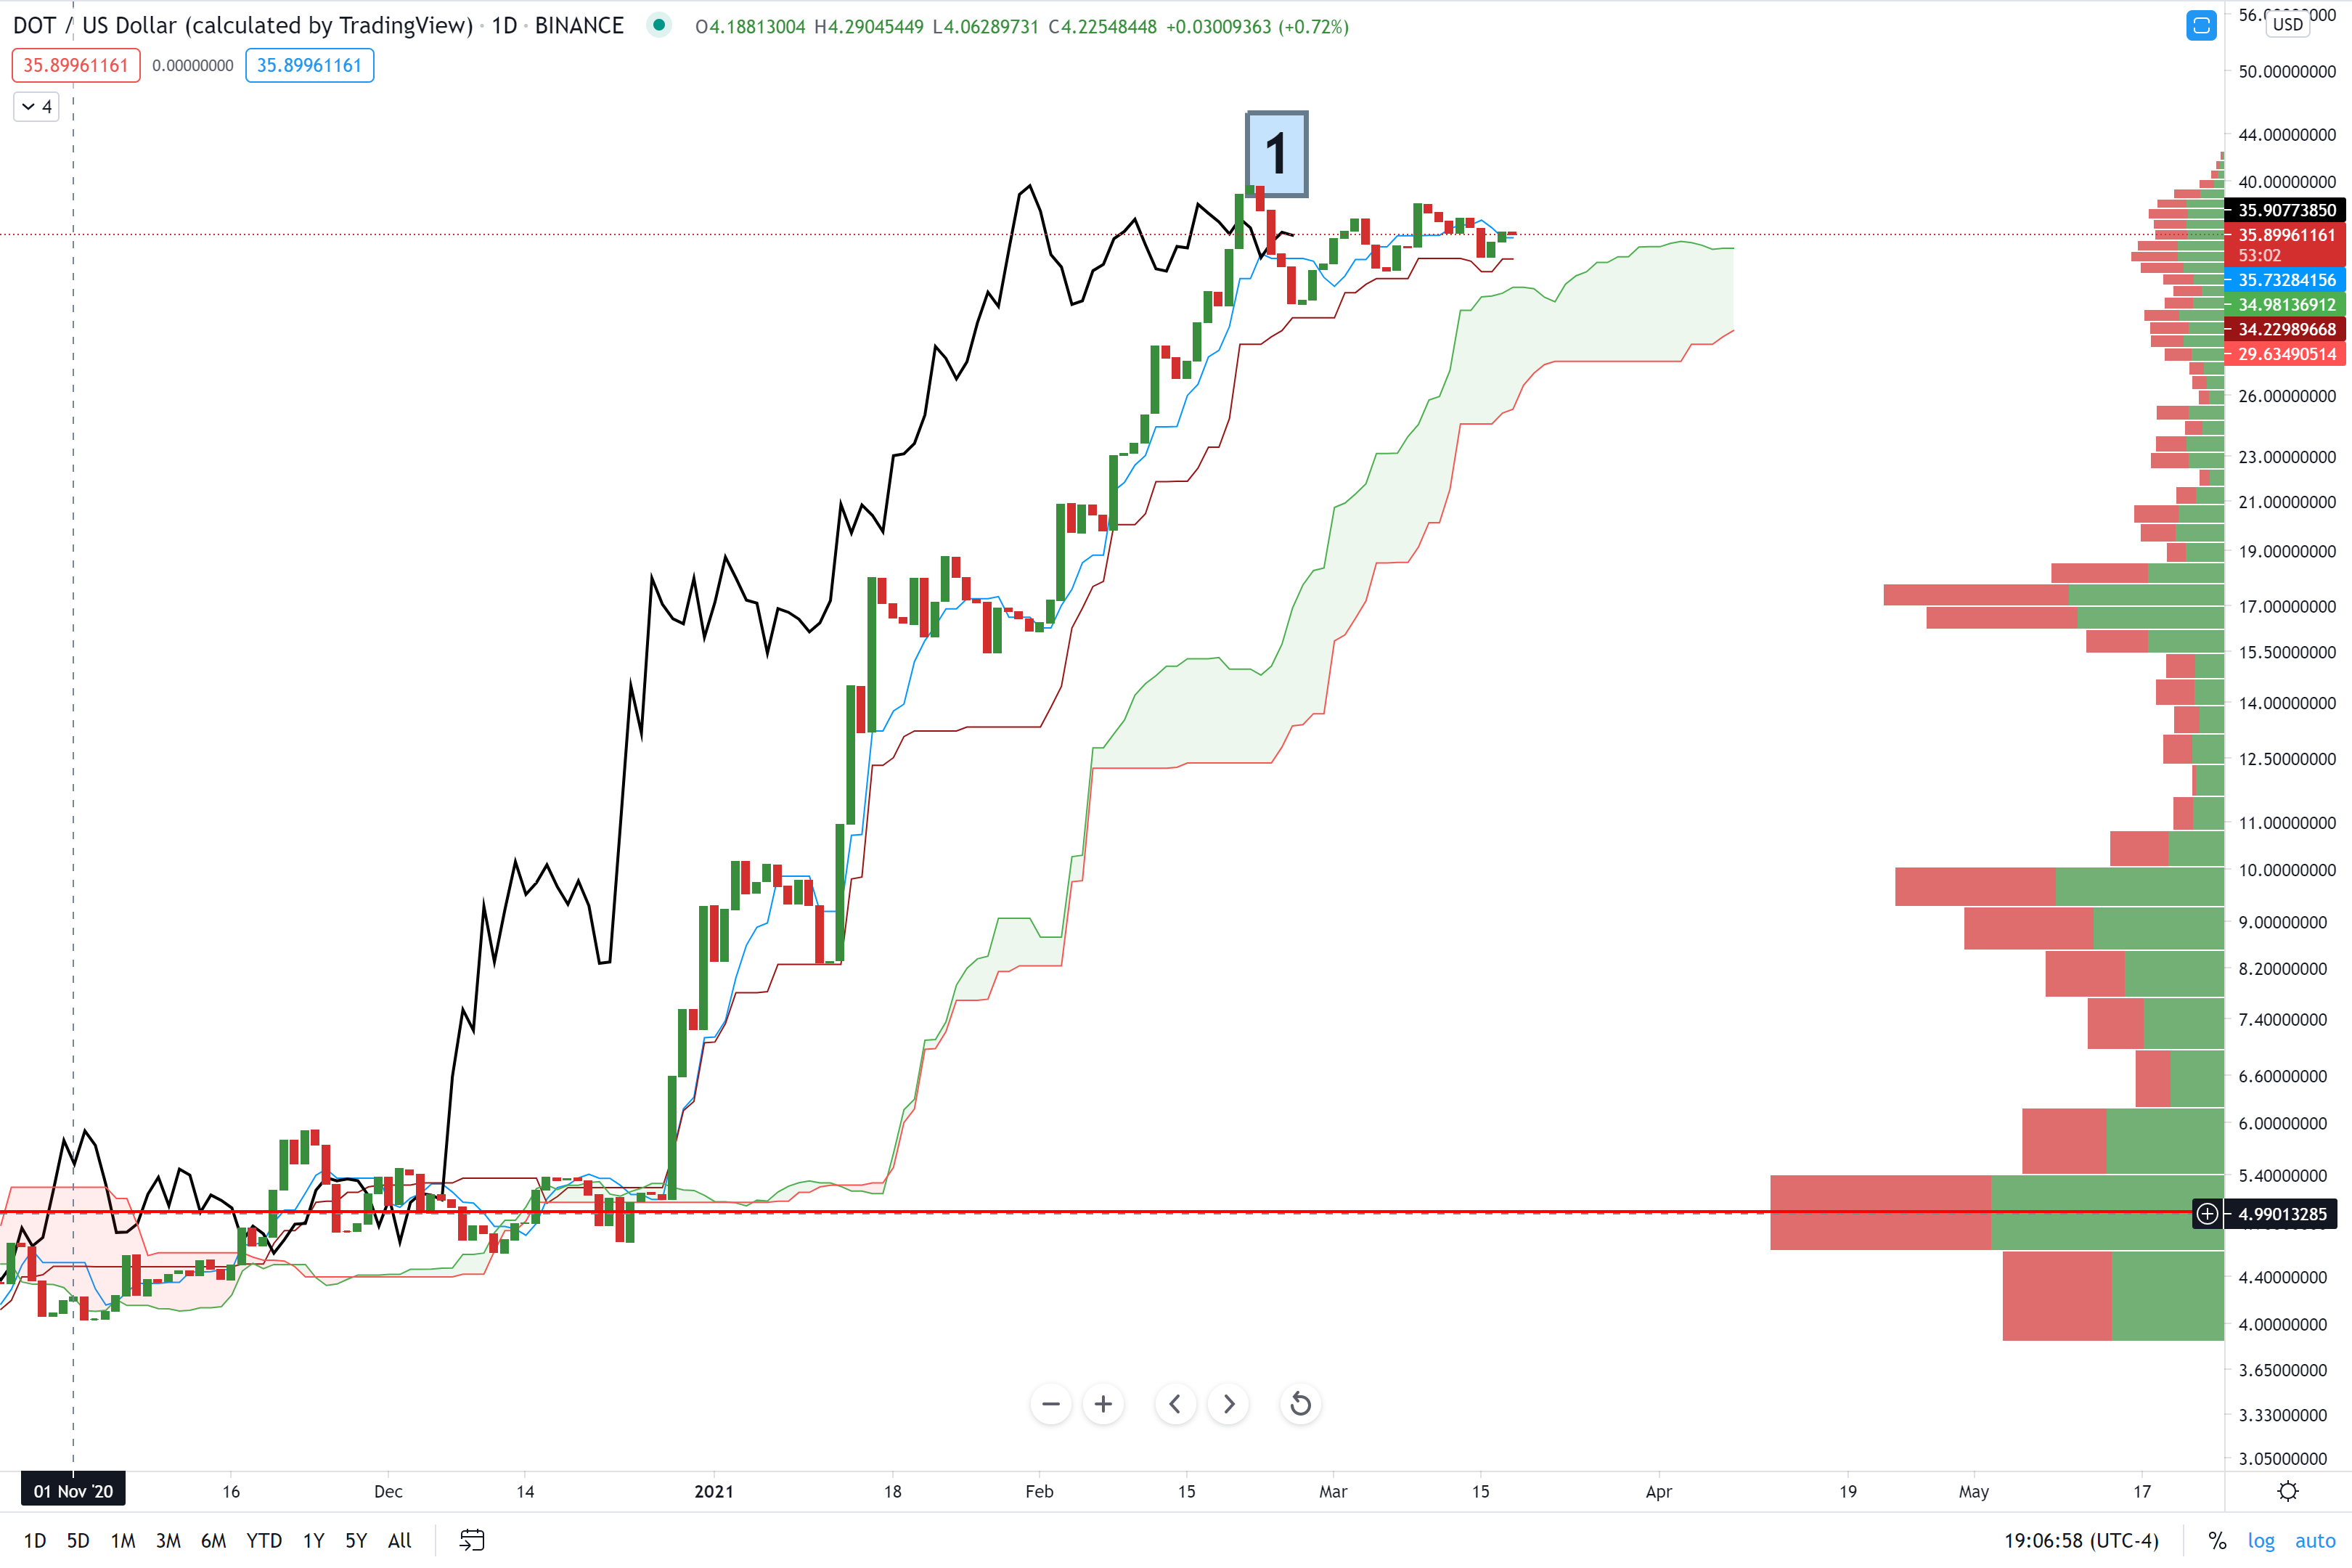
Polkadot is still so new that we have to use a daily Ichimoku chart instead of a weekly Ichimoku chart. I’ve also removed the wicks from the candlesticks to make the chart more clear.
Pro-tip: if the instrument you are trading looks like a centipede or millipede because of so many wicks above and below every candlestick, remove the wicks.
READ: Cardano (ADA) to hit $5? Probably – Cryptocurrency Price Forecast
The majority of conditions present on the daily Ichimoku chart are bullish:
 1.Future Span A above Future Span B
2.Current Span A above Current Span B
3.Consistent closes above the Kijun-Sen
4.Tenkan-Sen above the Kijun-Sen
5.Chikou Span above price.
All of the conditions listed above are signs of an extremely bullish market. But there are some signs the trend is going to face a broad correction or at least some prolonged congestion. The Chikou Span (black line at #1) is above the candlesticks – but turn the wicks on and it has been trading ‘inside’ the candlesticks – a clear warning of imminent consolidation. But the consolidation may not last as there is a good continuation pattern forming and nearing the end, we’ll tackle that next.
READ: Cardano Technical Analysis, Charts: ADA Poised to Move Higher [Video]
Polkadot (DOT) Elliot Wave Analysis
Above: Polkadot (DOT) Elliot Wave Analysis
Somewhere, someone who knows more about Elliot Wave than I do is reading this and working up an angry post or comment about how wrong this is. Chill. Elliot Wave is a theory and provides us with a framework to build a structure. If we assume that the structure I’ve drawn is correct, then we should get a good idea of where to buy for a pullback. I’ve drawn the corrective wave (ABC) to end where there is a confluence of two important price levels, both around the $18 value area. The first level is the high volume node in the Volume Profile. The second is the very, very important and powerful 161.8 Fibonacci Extension. The Fibonacci Extension is from the end the impulse wave and then from the corrective swings at A and B. Consequently, the value area at C is within range of where normal corrective waves would end relative to the impulse wave.
But here’s the issue with Elliot Wave – the projections and prior structure can be rendered moot when price fails to move the way you want it. The triangle drawn up above is known as a bullish pennant. Bullish pennants are one of the oldest and most traded patterns in technical analysis. In fact, there are a great many long term traders who only trade the continuation patterns of flags and pennants. Personally, I only like to trade pennants that are also wedge patterns. Why? Wedge patterns have the highest positive expectancy rate out of all triangle patterns. Symmetrical triangles, like the one above, have a below average profitability rate. That being said, the buy stop entry above the triangle would occur at $39.15.
Advertisement
Save money on your currency transfers with TorFX, voted International Money Transfer Provider of the Year 2016 – 2020. Their goal is to connect clients with ultra competitive exchange rates and a uniquely dedicated service whether they choose to trade online or over the telephone.
Find out more here.
[ad_2]


