[ad_1]
DOT/USD could surge above $40 and target new all-time highs if bulls hold gains made over the past three days
Polkadot (DOT) has recovered some of the losses suffered over the past week, with its price surging over 7% in the past 24 hours to break above $36.
At the time of writing, the 6th ranked DOT is trading at $36.71 against the US dollar.
Although the technical picture suggests bears are still within the framework, a positive move could see bulls bounce towards $42.
If the negative outlook seen over the past few days holds, DOT/USD could decline to support levels around $30.
DOT/USD daily price chart analysis
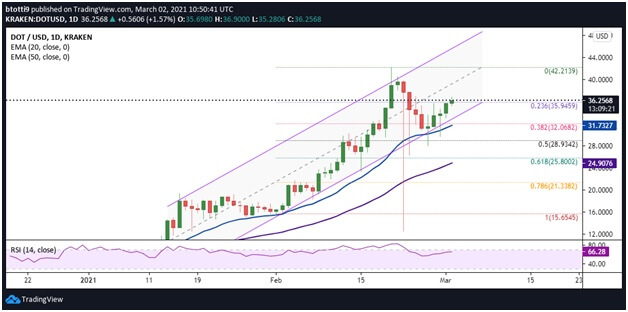
Polkadot is correcting upwards following a strong bounce over the past three days as shown on the daily chart. DOT/USD has printed consecutive green candles. The last two indicate bulls are trying to take the full initiative after what appeared like indecision towards the monthly close.
Also importantly, buyers are looking to strengthen even further along an ascending trend line. The positive moves come after bulls fought to keep prices above $30 following an aggressive sell-off this past week.
The candlesticks on 22 and 23 February featured long tails, which suggested that despite the downward pressure, buyers still had the appetite to push higher.

The rising curves of the 20 and 50-day exponential moving averages suggest the bullish setup is likely to remain in place short term. The RSI is also showing a positive divergence as it flips above 66, which suggests further upward action.
What bulls need is to hold onto gains above the 0.236 Fibonacci retracement level ($35.94). If they manage this, they can comfortably eye a move to $42.
On the downside, a strong initial support level is at the 20-day EMA ($31.72). Bulls could still have the upper hand if they keep prices above this level. However, the bullish view as shown on the daily log will flip negative if DOT/USD breaks below $30.
The next support level could therefore be at the 0.5 Fibonacci retracement level of the move from $15.65 low to $42.21 high. That anchor is currently around $28.93, and any more losses at this juncture could open the route to lows of $24 (where the 50 EMA provides support at $24.90).
DOT/USD 4-hour price chart analysis

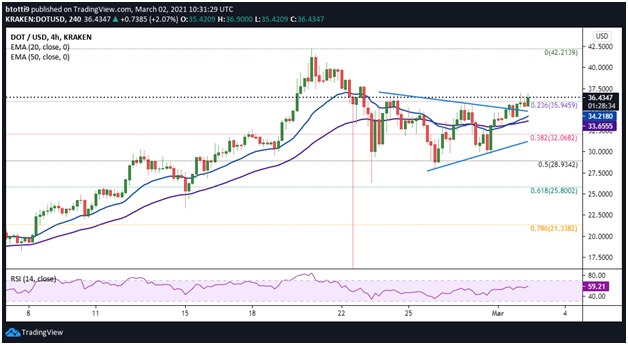
On the 4-hour chart, Polkadot has broken above the resistance line of a symmetrical triangle pattern. The upside has taken it past the main hurdle at $35, which is crucial as it allows bulls to build momentum above this continuation pattern.
The RSI is above the midpoint, while the EMA curves are suggesting an upward curve. This outlook suggests DOT/USD could continue higher and retest the $42 level, with a potential surge towards $50 if sentiment across the crypto market picks some tailwinds.
However, a slip below the trend line could see bears eye the 20 and 50-day EMAs at $34.21 and $33.65. The support line of the symmetrical triangle provides support at $32.
[ad_2]


